Most businesses have become too complex for leaders to see what’s happening on the frontline. So they delegate responsibility to departments.
The problem is, department heads only care about the part they’re responsible for. When things go wrong — as they often do in a volatile world — the blame game starts.
Solving this problem falls on the leader — who often has no clear view of what’s happening across the organisation.
There’s a simple solution to this problem.
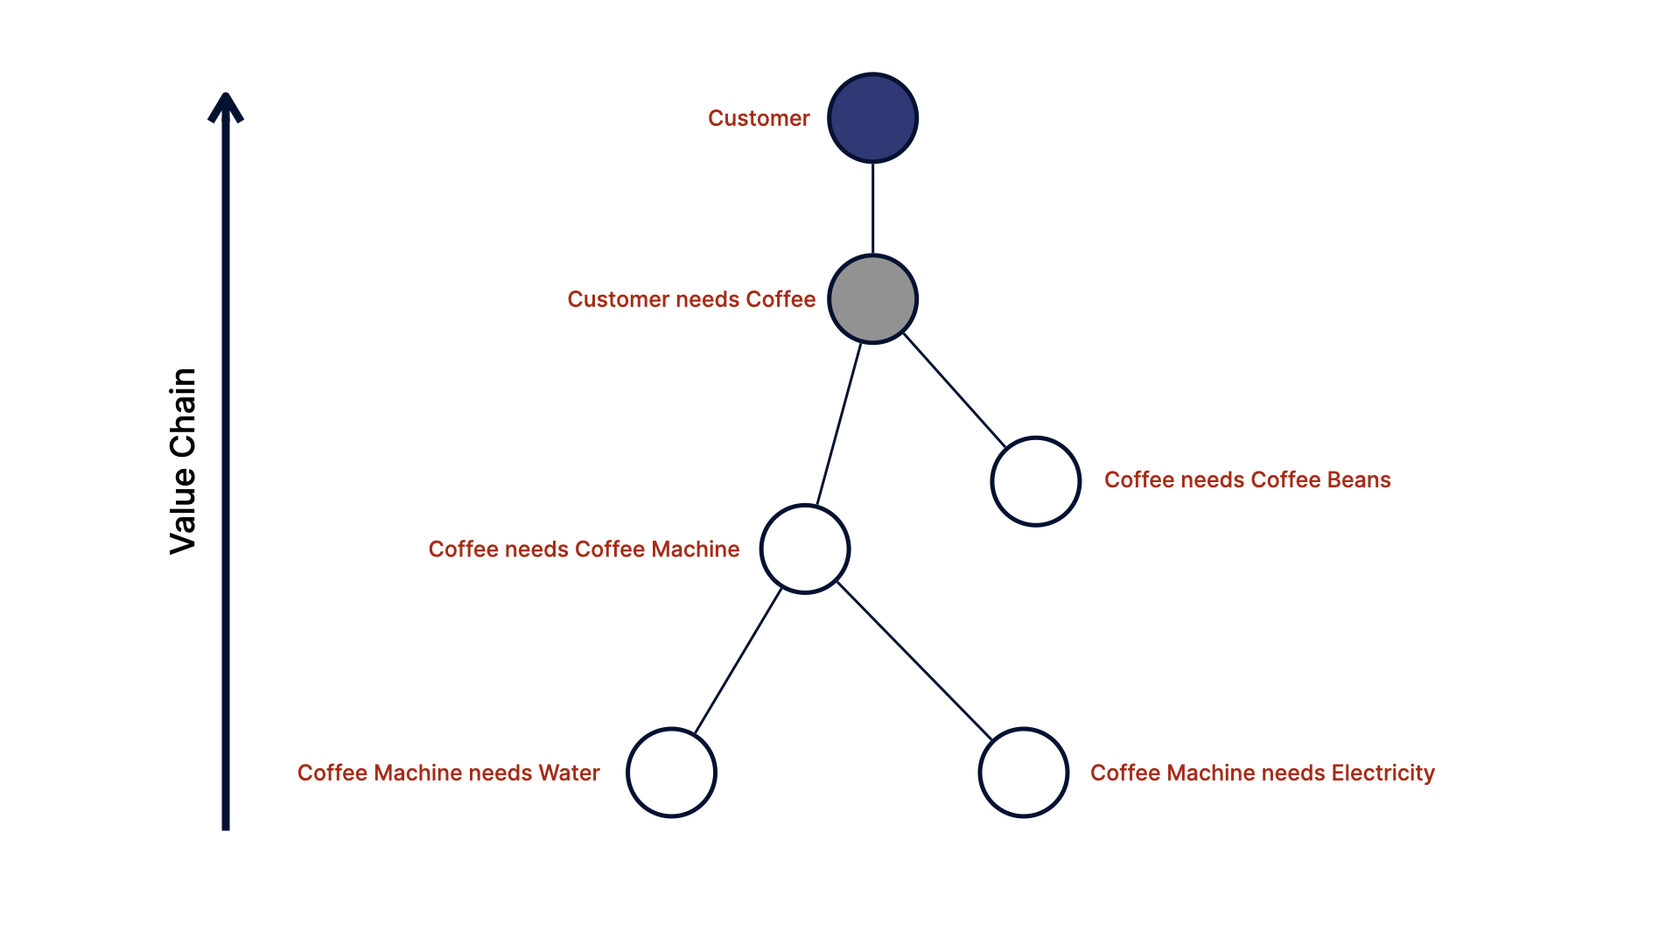
Map your value chain — show how your organisation creates value by satisfying user needs (see the simple coffeeshop example attached).
This is the first part of a Wardley Map — the North-South axis — showing how value is created today. Everyone can see what must be done, how to work together, and where breakdowns happen.
In my next post, I’ll show the West-East axis — revealing how your industry is changing and where value will be created tomorrow.
The problem is, department heads only care about the part they’re responsible for. When things go wrong — as they often do in a volatile world — the blame game starts.
Solving this problem falls on the leader — who often has no clear view of what’s happening across the organisation.
There’s a simple solution to this problem.
Map your value chain — show how your organisation creates value by satisfying user needs (see the simple coffeeshop example attached).
This is the first part of a Wardley Map — the North-South axis — showing how value is created today. Everyone can see what must be done, how to work together, and where breakdowns happen.
In my next post, I’ll show the West-East axis — revealing how your industry is changing and where value will be created tomorrow.